Experiments Results
Within 24 hours of your experiment's launch you'll start seeing data on the Results page. RevenueCat offers experiment results through each step of the subscription journey to give you a comprehensive view of the impact of your test. You can dig into these results in a few different ways, which we'll cover below.
Results chart
The Results chart should be your primary source for understanding how a specific metric has performed for each variant over the lifetime of your experiment.

By default you'll see your *Realized LTV per customer for all platforms plotted daily for the lifetime of your experiment, but you can select any other experiment metric to visualize, or narrow down to a specific platform.
Lifetime value (LTV) is the standard success measure you should be using for pricing experiments because it captures the full revenue impact on your business. Realized LTV per customer measures the revenue you've accrued so far divided by the total customers in each variant so you understand which variant is on track to produce higher value for your business.
Keep in mind that your LTV over a longer time horizon might be impacted by the renewal behavior of your customers, the mix of product durations they're on, etc.
You can also click Export chart CSV to receive an export of all metrics by day for deeper analysis.
The results refresher runs once every 24 hours.
If you're not seeing any data or are seeing unexpected results, try:
- Ensuring each product that is a part of the experiment has been purchased at least once
- Waiting another 24 hours until the model can process more data
When you stop an experiment, the results will continue to be updated for the next 400 days to capture any additional subscription events, and allow you to see how your Realized LTV matures for each variant over time.
Customer journey tables
The customer journey tables can be used to dig into and compare your results across variants.
The customer journey for a subscription product can be complex: a "conversion" may only be the start of a trial, a single payment is only a portion of the total revenue that subscription may eventually generate, and other events like refunds and cancellations are critical to understanding how a cohort is likely to monetize over time.
To help parse your results, we've broken up experiment results into three tables:
- Initial conversion: For understanding how these key early conversion rates have been influenced by your test. These metrics are frequently the strongest predictors of LTV changes in an experiment.
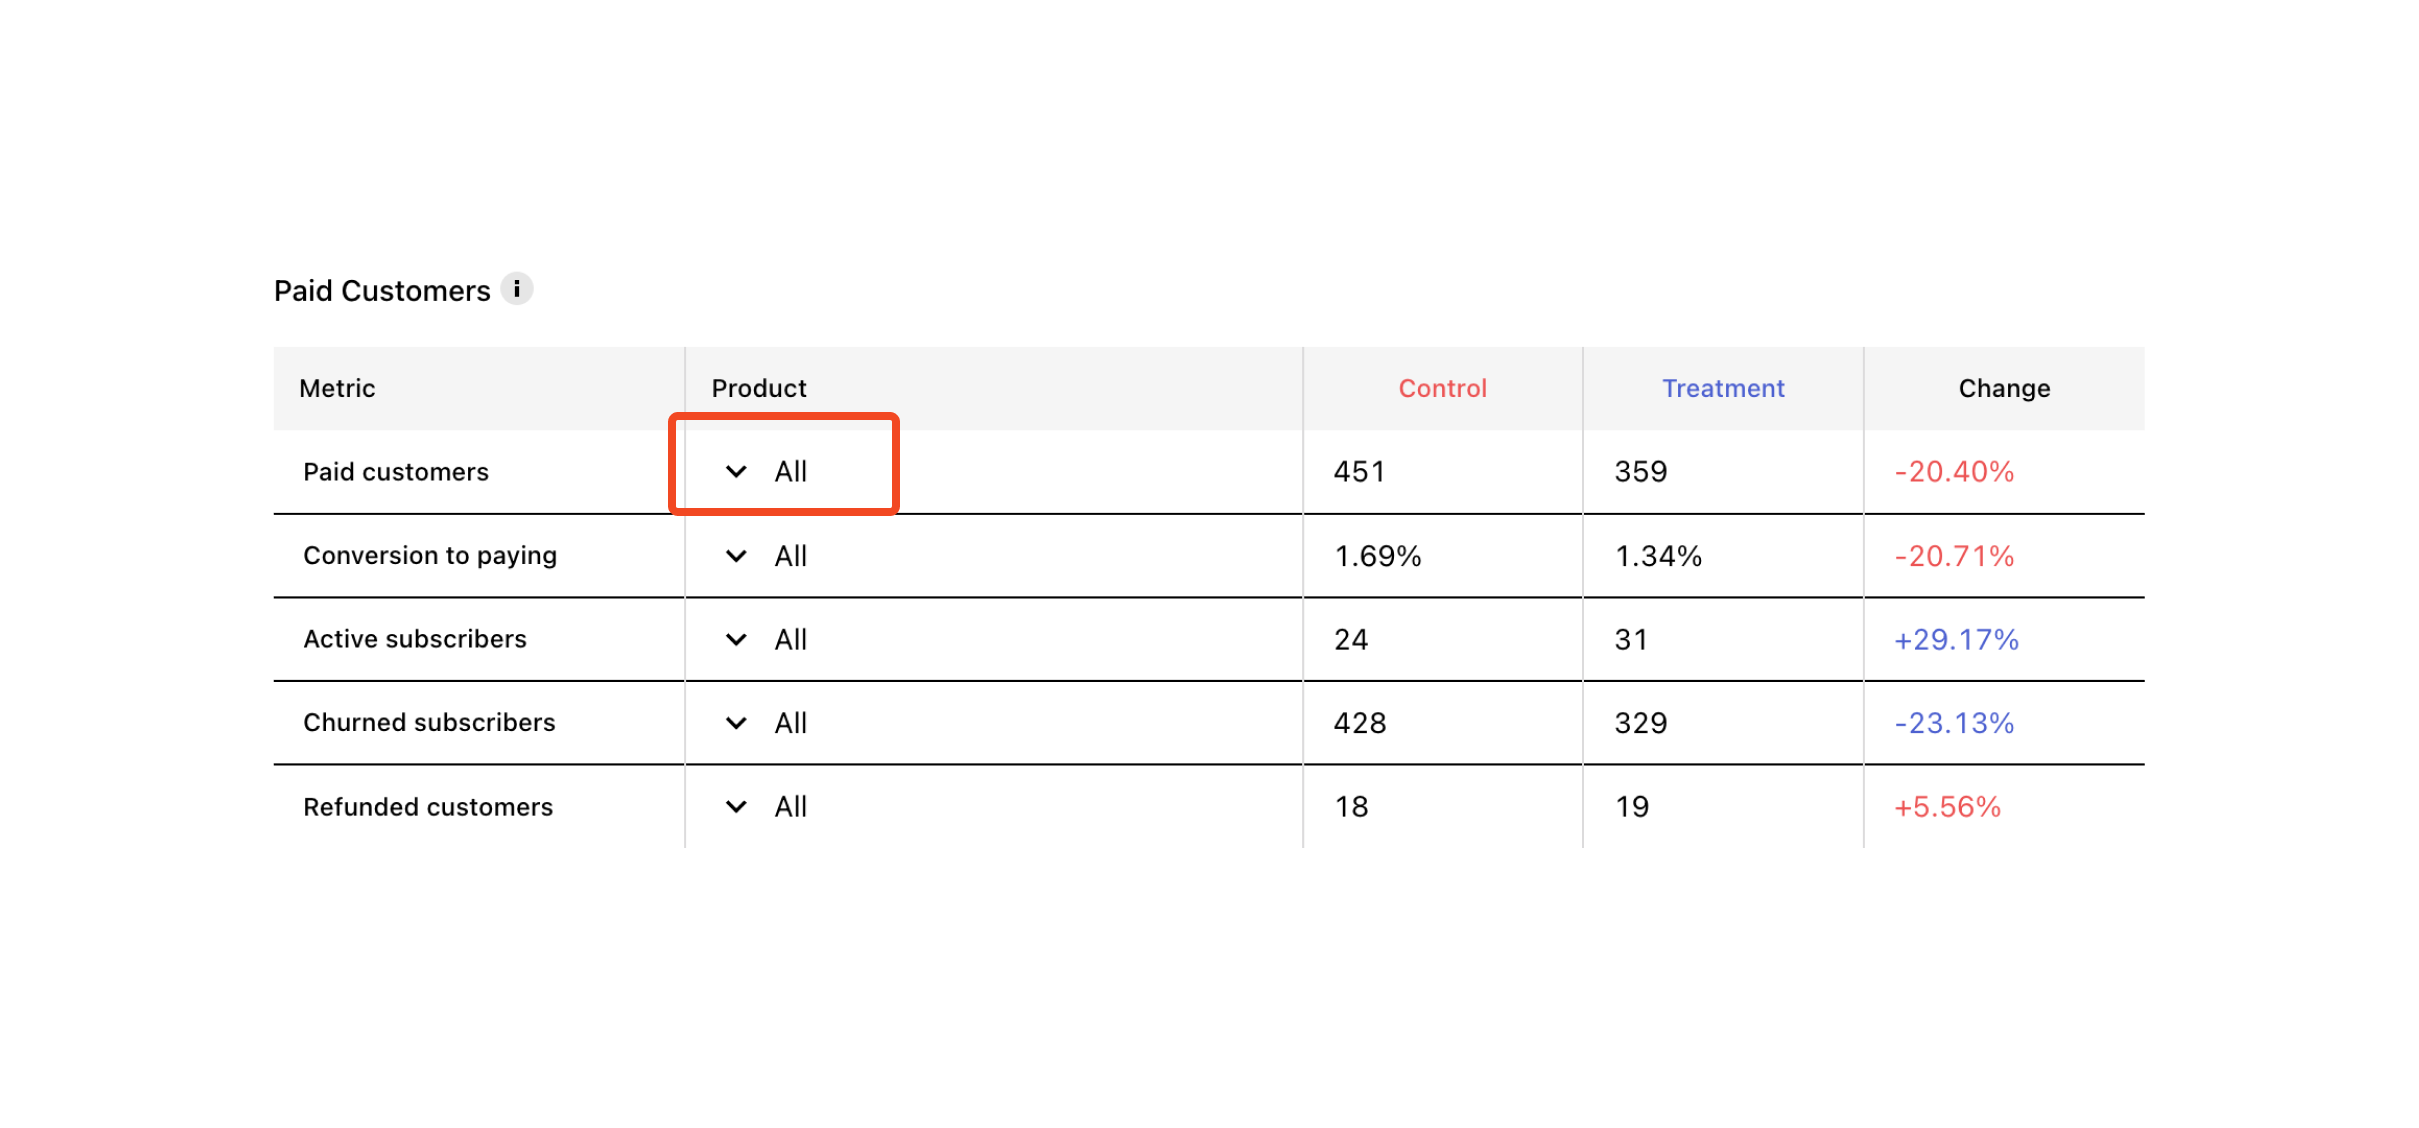
- Paid customers: For understanding how your initial conversion trends are translating into new paying customers.
- Revenue: For understanding how those two sets of changes interact with each other to yield overall impact to your business.

In addition to the results per variant that are illustrated above, you can also analyze most metrics by product as well. Click on the caret next to "All" within metrics that offer it to see the metric broken down by the individual products in your experiment. This is especially helpful when trying to understand what's driving changes in performance, and how it might impact LTV. (A more prominent yearly subscription, for example, may decrease initial conversion rate relative to a more prominent monthly option; but those fewer conversions may produce more Realized LTV per paying customer)
The results from your experiment can also be exported in this table format using the Export data CSV button. This will included aggregate results per variant, and per product results, for flexible analysis.
If the Realized LTV of your Treatment is performing meaningfully worse than your Control, we'll automatically email you to let you know about it so that you can run your test with confidence.
Metric definitions
Initial conversion metric definitions
Customers All new customers who've been included in each variant of your experiment.
Initial conversions A purchase of any product offered to a customer in your experiment. This includes products with free trials and non-subscription products as well.
Initial conversion rate The percent of customers who purchased any product.
Trials started The number of trials started.
Trials completed The number of trials completed. A trial may be completed due to its expiration or its conversion to paid.
Trials converted The number of trials that have converted to a paying subscription. Keep in mind that this metric will lag behind your trials started due to the length of your trial. For example, if you're offering a 7-day trial, for the first 6 days of your experiment you will see trials started but none converted yet.
Trial conversion rate The percent of your completed trials that converted to paying subscriptions.
Paid customers metric definitions
Paid customers The number of customers who made at least 1 payment. This includes payments for non-subscription products, but does NOT include free trials. Customers who later received a refund will be counted in this metric, but you can use "Refunded customers" to subtract them out.
Conversion to paying The percent of customers who made at least 1 payment.
Active subscribers The number of customers with an active subscription as of the latest results update.
Active subscribers (set to renew) The number of customers with an active subscription who are set to renew their subscription (e.g. they have not cancelled) as of the latest results update.
NOTE: This measure is only available in the Customer Journey data table, not the Results chart.
Churned subscribers The number of customers with a previously active subscription that has since churned as of the latest results update. A subscriber is considered churned once their subscription has expired (which may be at the end of their grace period if one was offered).
Refunded customers The number of customers who've received at least 1 refund.
Revenue metric definitions
Realized LTV (revenue) The total revenue you've received (realized) from each experiment variant.
Realized LTV per customer The total revenue you've received (realized) from each experiment variant, divided by the number of customers in each variant. This should frequently be your primary success metric for determining which variant performed best.
Realized LTV per paying customer The total revenue you've received (realized) from each experiment variant, divided by the number of paying customers in each variant. Compare this with "Conversion to paying" to understand if your differences in Realized LTV are coming the payment conversion funnel, or from the revenue generated from paying customers.
Total MRR The total monthly recurring revenue your current active subscriptions in each variant would generate on a normalized monthly basis. Learn more about MRR here.
Total MRR (set to renew) The total monthly recurring revenue your current active subscriptions who are currently set to renew (e.g. they have not cancelled) in each variant would generate on a normalized monthly basis.
NOTE: This measure is only available in the Customer Journey data table, not the Results chart.
MRR per customer The total monthly recurring revenue your current active subscriptions in each variant would generate on a normalized monthly basis, divided by the number of customers in each variant.
MRR per paying customer The total monthly recurring revenue your current active subscriptions in each variant would generate on a normalized monthly basis, divided by the number of paying customers in each variant.
To keep your A and B cohorts on equal footing, only new users are added to experiments. Here's an example to illustrate what can happen if existing users are added to an experiment: an existing user who is placed in a cohort might make a purchase they wouldn't otherwise make because the variant they were shown had a lower price than the default offering they previously saw. This might mean that the user made a purchase out of fear that they were missing out on a sale and wanted to lock in the price in anticipation of it going back up.
FAQs
What is included in the "Other" category in the product level breakdown of my results?
If the customers enrolled in your experiment purchased any products that were not included in either the Control or Treatment Offering, then they will be listed in the "Other" category when reviewing the product-level breakdown of a metric. \n \nThis is to ensure that all conversions and revenue generated by these customers can be included when measuring the total revenue impact of one variant vs. another, even if that revenue was generated from other areas of the product experience (like a special offer triggered in your app).
Why do the results for one variant contain purchases of products not included in that variant's Offering?
There are many potential reasons for this, but the two most common occur when (1) there are areas of your app that serve products outside of the Current Offering returned by RevenueCat for a given customer, or (2) the offered Subscription Group on the App Store contains additional products outside of that variant's Offering. \n \nFor the first case, please check and confirm that all places where you serve Products in your app are relying on the Current Offering from RevenueCat to determiner what to display. \n \nFor the second case, we recommend creating new Subscription Groups on the App Store for each Offering so that a customer who purchases from that Offering will only have that same set of options to select from one when considering changing or canceling their subscription from Subscription Settings on iOS.
When I end an Experiment, what Offering will be served to the customers who were enrolled in that Experiment?
When an Experiment is ended, all customers previously enrolled in it will be served the Default Offering the next time they reach a paywall in your app.
How can I review the individual customers who were enrolled in my experiment?
When using the Get or Create Subscriber endpoint you'll be able to see if an individual subscriber was enrolled in an experiment, and which variant they were assigned to, and can then pass that fact to other destinations like an analytics provider like Amplitude & Mixpanel, or your own internal database.
How can I review the individual transactions that have occurred in my experiment?
Our Scheduled Data Exports include the experiment enrollment of each subscriber in the reported transactions, and by subscribing to them you can receive daily exports of all of your transactions to analyze the experiment results further.
How can I filter my results by other dimensions like Country in the Dashboard?
Our Dashboard only supports filtering by Platform today, but if there are specific countries you're looking to distinctly measure results for you can instead run simultaneous tests targeting each set of countries. Then, each tests results will tell you how the experiment performed in that country set so you can determine where the change was and was not successful